Ocean Satellites
Satellites are supported by state-of-the-art technology.
Satellites started becoming useful oceanographic tools in the 1970s.
NOAA (national Oceanic and Atmospheric Administration) of the USA tracks more than 15000 satellites and satellite pieces orbiting the earth.
Satellites provide a variety of services, e.g. communication (more than 300 for TV, 60 for amateur radio, etc), earth observation (including more than 400 geostationary satellites), positioning (like 36 for GPS), search and rescue (15), education (18), disaster monitoring (13), etc.
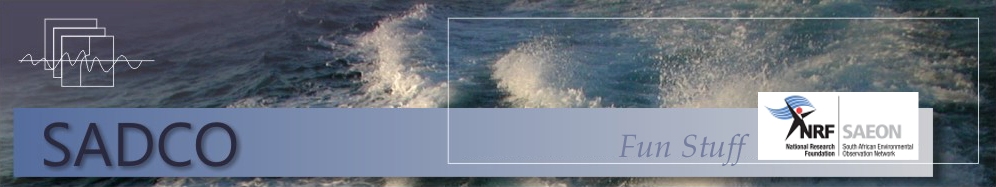
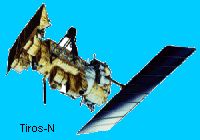
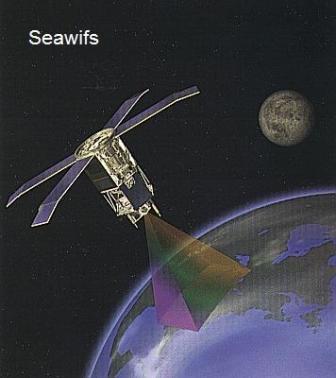
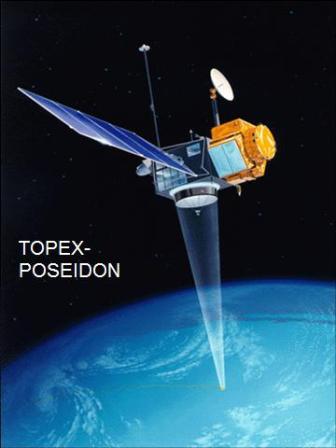
What do satellites look like? Satellites are custom designed around specific sensors and operations. Each satellite is a complex array of components, including solar panels to provide power, antennae for transmitting data, small thrusters, huge amount of electronics (computer hardware) and sensors. A typical size of a satellite would be that of a small car.
If the satellite orbits the earth a few hundred kilometres above the earth’s surface, the orbit period is approximately 100 minutes and the speed of the satellite is about 7 km/sec.
|
|
|
|
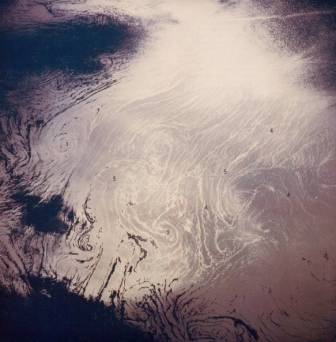
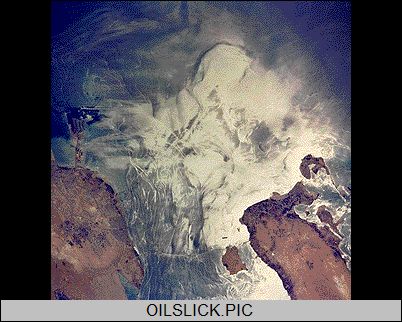
Visible imagery
Visible images are used at an angle to show sun glint, and this indicates surface slicks in the ocean
|
|
| Oil slicks | Eddies in the Mediterranean |
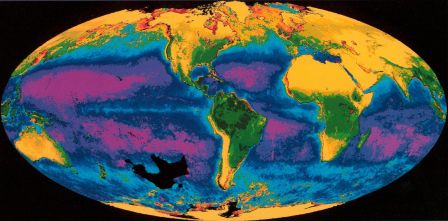
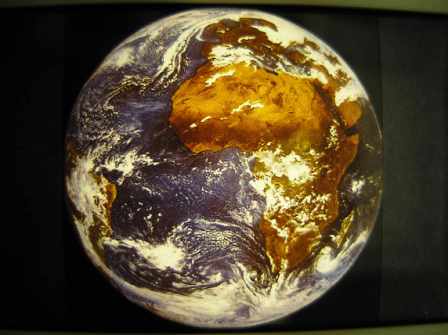
Chlorophyll
Colour imagery is used to determine the degree of “greeness” in the ocean, and this can be related to the amount of chlorophyll in the water. The image shows higher chlorophyll (shaded as red) along the west coast of Southern Africa, North Africa, South America and North America
False colour, METEOSAT (geostationary) infrared image
METEOSAT is a geostationary satellite, position above the equator and the Greenwich meridian (about 36 000 km from the earth). An infrared image is obtained every 30 minutes, at a resolution of 5 km. This image is coded with false colour, and is especially useful to show cloud patterns (white). With the regular coverage, the movement of clouds can be animated, helping to determine the propagation of fronts and cloud patterns
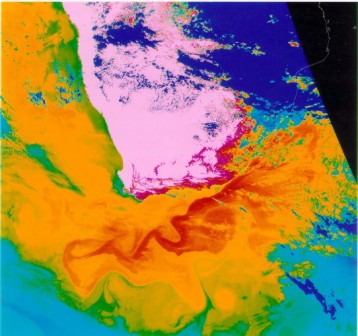
False colour, NOAA infrared image
This infrared image was collected by the NOAA satellite (infrared = heat patterns). Higher temperatures in the ocean have been coloured shades of red and orange, while colder water appear in shades of green and blue.
The Agulhas Current can be seen southeast and south of the continent. Especially noticeable is the large meandering, as well as the associated eddy formation
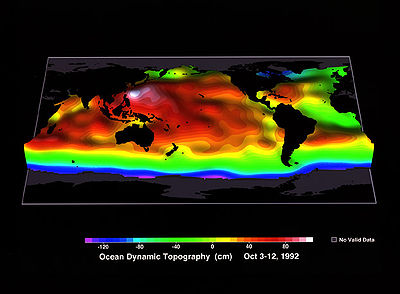
Altimetry (ocean topography)
TOPEX/Poseidon was the first space mission that allowed scientists to map ocean topography with sufficient accuracy to study the large-scale current systems of the world's ocean. Although this image was constructed from only 10 days of TOPEX/Poseidon data (October 3 to October 12, 1992), it reveals most of the current systems that have been identified by shipboard observations collected over the last 100 years. Yellow-red = “bumps”; green-blue= “troughs”, relative to the mean sea level
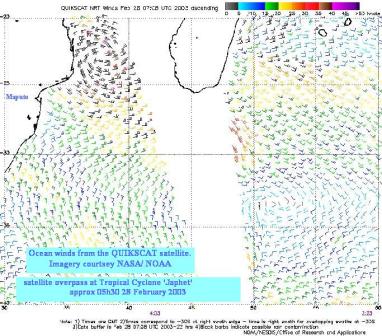
Quickscat wind data
The wind vectors derived from Quickscat shows a strong, clockwise circulation (= tropical cyclone Japhet) in the Mozambique Channel and a weaker cyclonic field southeast of Madagascar
For real-time satellite imagery, visit: http://www.afro-sea.org.za/